1. Keep the measurement setup consistent
Choose a site and keep the analyzer, antenna, cable, and antenna position as steady as practical. Record any antenna or signal-path details you will need when comparing runs. If a strong signal may overload the input, check the analyzer setup and use appropriate attenuation or filtering before interpreting the trace.
Connect the tinySA in the app's Device tab. Then open Survey → New. If you need help with the connection, see the USB OTG guide.
2. Choose the capture settings
- Name the survey and set Center frequency and Capture span so the frequencies of interest fit within the displayed capture range.
- Choose RBW. A fixed setting helps when comparing runs. With Auto RBW, the applied bandwidth may not be reported, which limits comparability and some statistical qualification.
- Set input attenuation and LNA only when those controls are available for your device and input path. Enabling LNA sets input attenuation to 0 dB in the app.
- Review the Activity threshold. It is a power level at the analyzer input, in dBm, used to count active sweep points. It is not a universal noise threshold or a regulatory limit.
Record site location requests one optional phone location fix when the survey starts. It does not verify that the analyzer remains stationary. The optional measurement metadata fields let you keep notes on the antenna, cable loss, and external attenuation.
For a different frequency detail versus collection speed tradeoff, Settings → Collection scan points offers 121, 290, or 450 points, subject to the connected device's supported maximum. This setting applies to collection sweeps, not the analyzer's own display sweep points.
3. Collect and inspect
Tap Start Survey and let several sweeps finish. Collection is sequential: the next sweep starts after the previous sweep and its save complete. The actual revisit time can vary, so do not assume a fixed sampling interval. Use Pause and Resume if needed, then Stop Survey to finish.
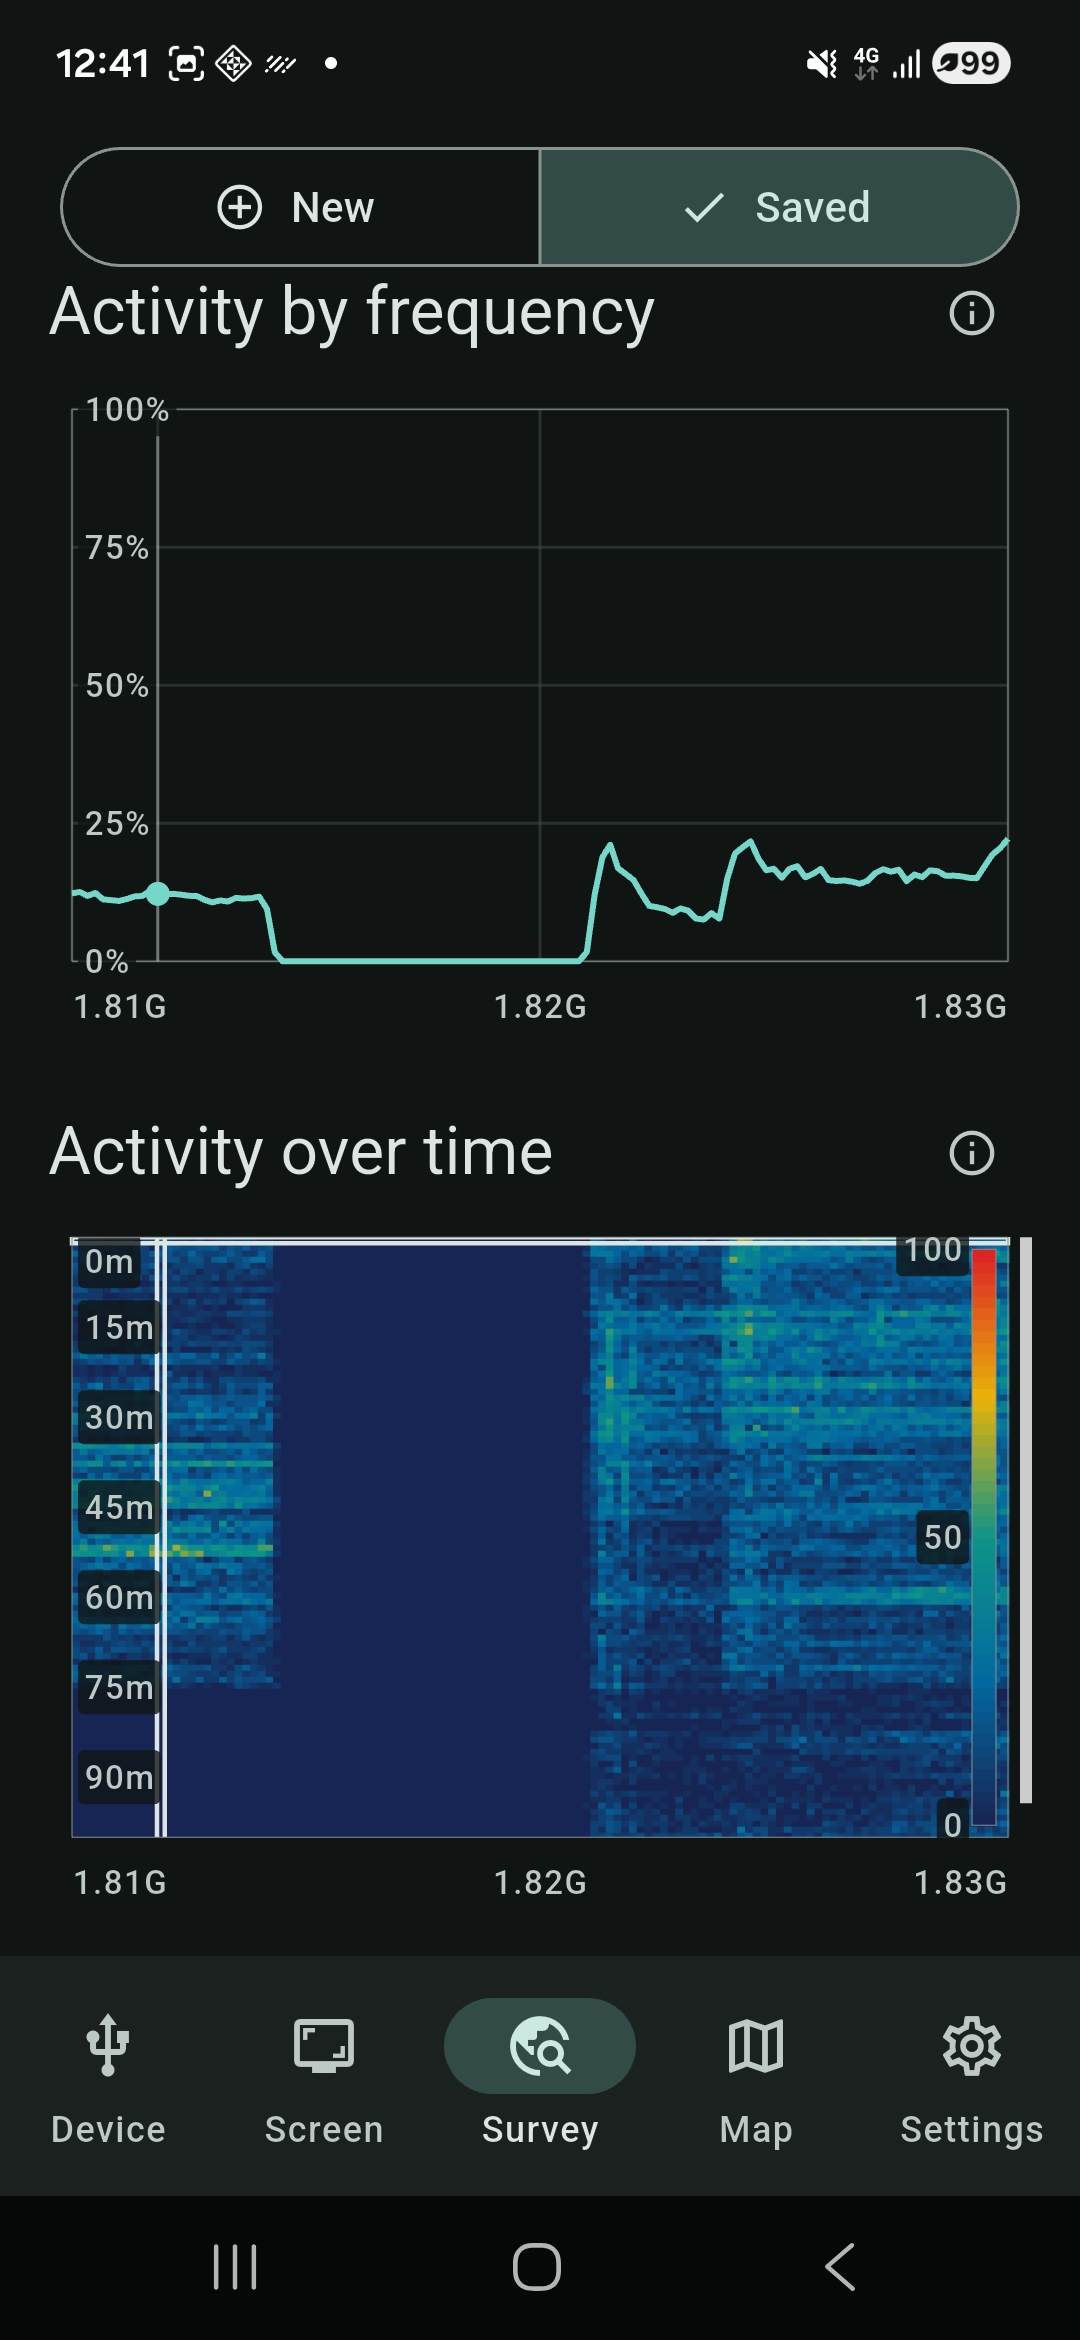
Open Survey → Saved and select the project. The results show frequency activity and a time history. A displayed activity percentage is the share of valid recorded samples at a frequency that met or exceeded the selected threshold. Change the threshold in the saved result to test how that interpretation changes.
Interpretation limit: a swept analyzer observes each frequency only during its sweep. A short transmission between visits can be missed. Activity and occupancy results describe the recorded samples; they are not continuous monitoring or compliance findings.
Get RF Survey Companion on Google Play to collect and review these surveys with a compatible tinySA.